CAAMP’s annual State of the Residential Mortgage Market report: What you need to know.
CAAMP’s annual State of the Residential Mortgage Market report is dense with pertinent real estate information; so dense, in fact, that many may simply sift through and miss the more pertinent statistics.
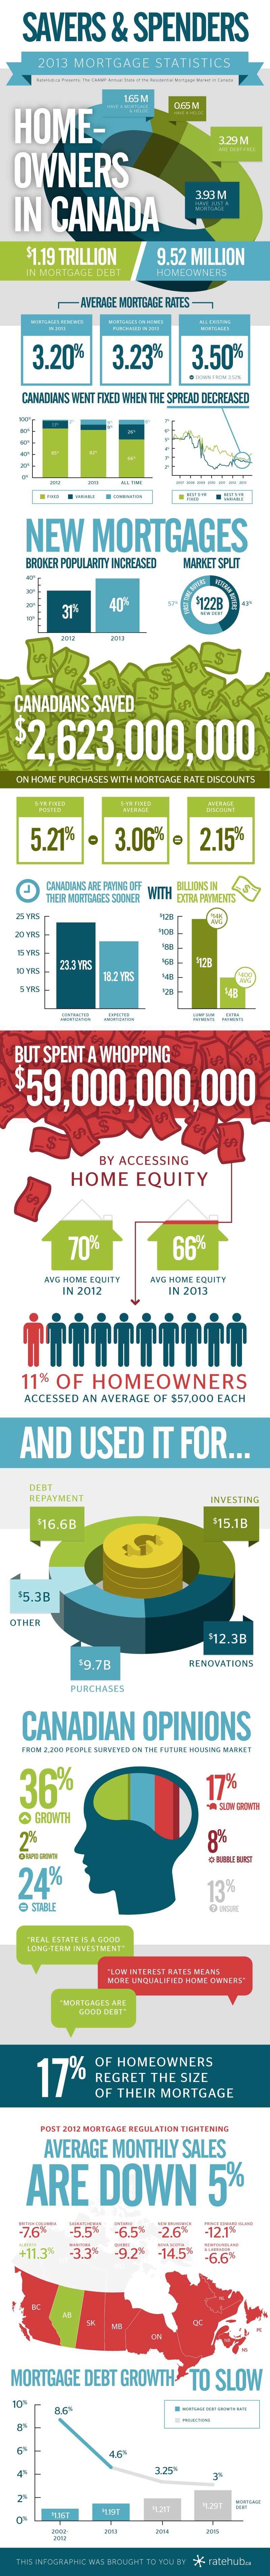
With that in mind, Ratehub.ca sifted through the report and designed an infographic detailing the saving and spending habits of the Canadian homebuyer. Below are some of the more interesting tidbits and the entire infographic can be seen below.
- There are 9.52 million homeowners in Canada and $1.19 trillion in mortgage debt
- Fixed-rate mortgages dropped from 85 per cent in 2012 to 82 per cent in 2013
- 57 per cent of homebuyers were first-timers
- There was $122 billion in new debt recorded
- The five-year fixed posted rate was 5.21 per cent; the average was 3.06 per cent
- The average contracted amortization period was 23.3 years but with extra payments the average expected amortization is 18.2 years
- There were $4 billion worth of extra payments made
- Canadians spent $59 million by accessing home equity
- The average home equity dropped from 70 per cent in 2012 to 66 per cent in 2013
- The mortgage regulation tightening in 2012 caused a five per cent dip across Canada. Here is how each province fared:
- BC: -7.6 per cent
- Alberta: + 11.3 per cent
- Saskatchewan: -5.5 per cent
- Manitoba: -3.3 per cent
- Ontario: -6.5 per cent
- Quebec: -9.2 per cent
- New Brunswick: -2.6 per cent
- Nova Scotia: -14.5 per cent
- PEI: -12.1 per cent
- Newfoundland & Labrador: -6.6 per cent